How to create
Summary of Frequencies tables using Express Tables from Variable Data
Step
1 - Open your
variable type data file using File|Open
Data.
Step 2
- Select Setup|Express
Tables from Variable Data.
- If you have not opened a previously
saved job file or selected File|New
Job, you will be prompted to create a new job file.
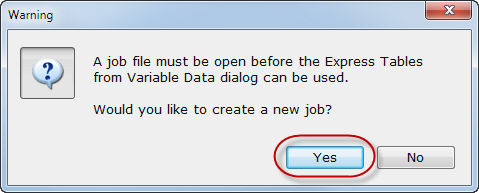
- Select Yes
on the Warning dialog.
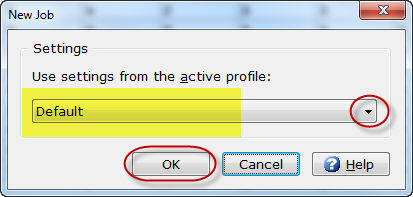
- Choose a profile from the dropdown
list if the active profile displayed is not the profile you want to
use for this job.
- Select OK.
Step
3 - You are now ready to create a Summary
of Frequencies table from the variables in your SPSS data file.
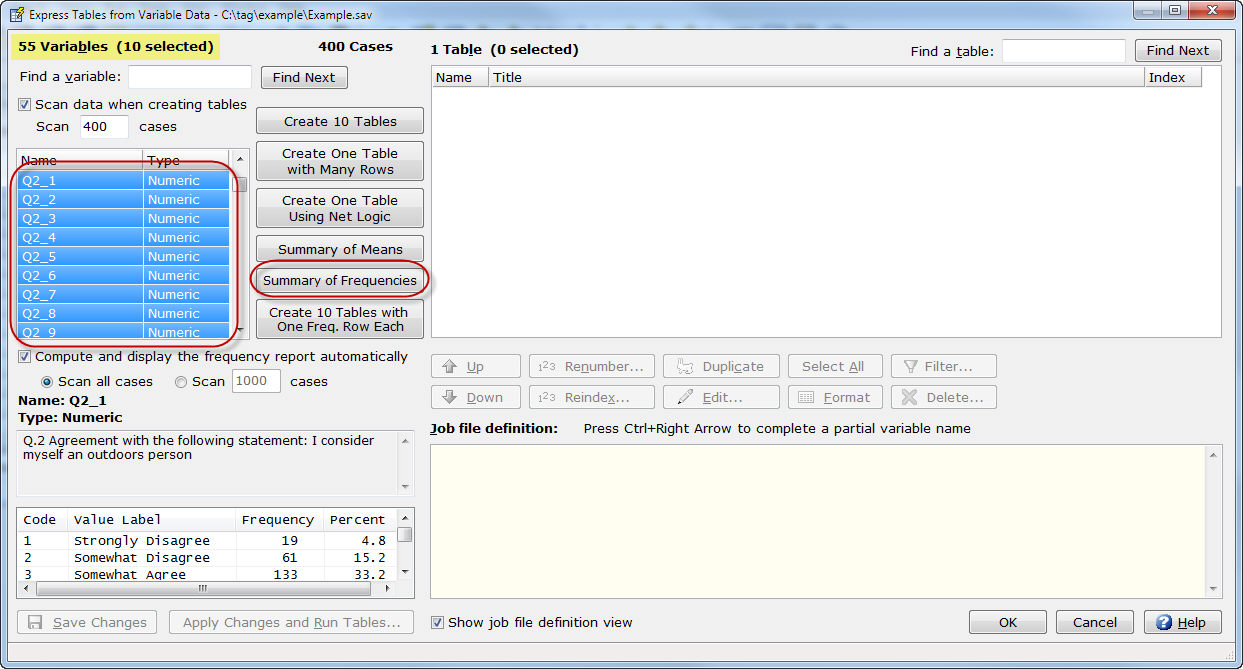
- Select the variable(s) that you want
to use for your Summary of Frequencies
table. In the example above, we have selected 10 of the 55 variables
from the open data file. We will create one Summary
of Frequencies table. In our example, Q2_1 through Q2_10 are
a series of rating questions with the same table structure. Variables
selected do not have to be contiguous. You can use the Ctrl
key when selecting non-contiguous variables from the list.
- Choose Summary
of Frequencies.
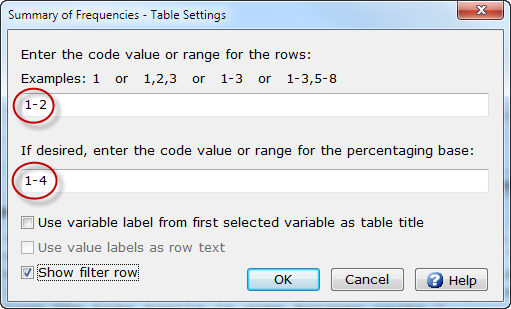
- Enter
the code value or range for the rows to be used for row logic.
In our example, Q2_1 through Q2_10 have a rating scale of 1-4 and
we will use code values 1-2 for the row logic of a Top
Two Box Summary table.
- In the example above, we are using
the range of code values 1-4 for our percentaging base. This is an
optional feature but when specified, creates two sets of rows, the
first set to be hidden and used as percentaging bases for the second
set of rows.
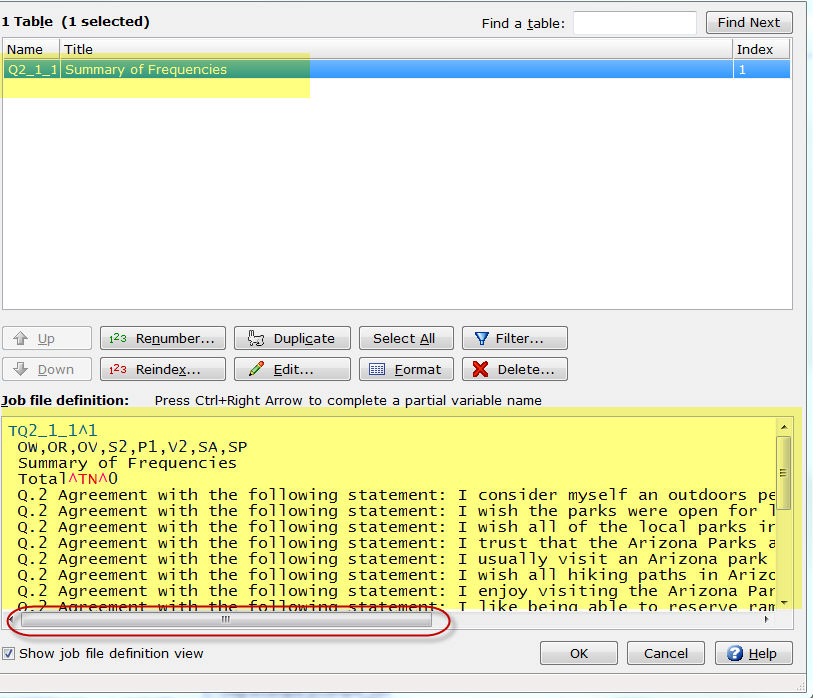
- As you can see from the example above,
one Summary of Frequencies
table has been created.
- The row text for the table is created
using the Variable Label from
each variable selected.
- The row logic for the table is created
using the Code Values or range
of Code Values specified for
the variables selected.
- Use the horizontal scroll bar to
scroll right for viewing the row logic and row options automatically
specified for you.
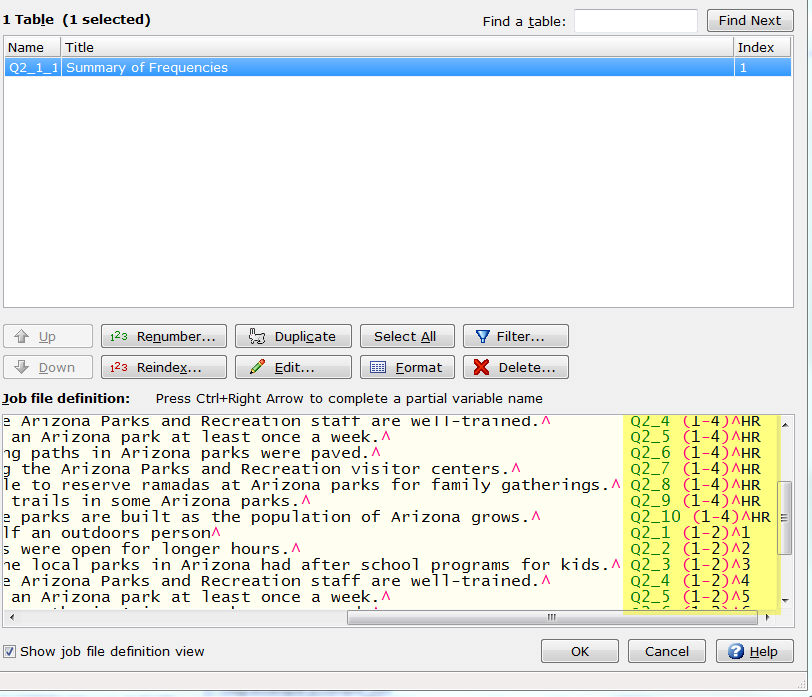
- As you can see above, the first set
of rows is created with the Hide
row option (HR) specified. The second set of rows is created
with the percentaging row specified (i.e. 1 or 2 or 3 or 4, etc.).
The percentaging row is a numeric value that represents the sequence
number of the row being used for percentaging. In the example above,
the row with row logic of Q2_1 (1-2)^1 has a percentage base of 1
representing row 1 of the table.
- The Summary
of Frequencies option is a quick and easy way to create summary
tables such as Top Two Box Summary
and Bottom Two Box Summary
for your WinCross job.
Related topics:
How
to create tables using Express Tables from Variable Data
How
to create Summary of Means tables using Express Tables from Variable Data
Setup|Express Tables from Variable Data
Express Table Editor