Excel Report Options
IMPORTANT: Microsoft®
Office Excel must be installed to write to Excel. |
Choose
a destination for the Excel report:
Save to a Local Destination
Saves your Excel
Report to a local or network folder of your choice.
Save
to TAG Drive (For new customers and customers in the WinCross annual
maintenance program)
Allows
you to save your Excel Report
to our TAG Drive.
TAG Drive
is a cloud-based file storage feature of the TAG Client Portal and allows
you to save files that are accessible from anywhere. This can be especially
helpful if you are traveling or working from home and do not have access
to your network drives from outside of the office.
Display files of
type:
- Excel
97-2003 (.xls) displays only Excel files with the extension
*.xls.
- Excel
2007-2013 (.xlsx) displays only Excel files with the extension
*.xlsx
- All
Excel Files (.xls, .xslx) displays only Excel files with either
the extension of *.xls or *.xlsx.
- The WinCross default is to display
all files of any extension in the current folder.
Drive/Directory
- The folder for the open job file
location is the default.
- Choose another folder if you want
the report file saved to another folder or browse to and select a
new location in the Drive/Directory
list boxes.
Files
- Select a file name from the Files list box or enter a new file
name in the Excel filename
field.
Excel output filename
- The
current file name is shown in the Excel output
filename field.
- The
default name is the job name with an .xls or .xlsx extension depending on which
version of Excel you select from the Output
file type dropdown list.
- You can modify the file name in
the Excel output filename
field.
Saved
Excel options:
- You can save the selected Excel
Options to a file name of your choice by selecting the Save As option to the right of the
Saved Excel options: dropdown
list.
- When an existing file of Excel
Options is selected from the dropdown list of Saved
Excel options, choose Save
to save any changes made to that set of Excel
Options.
- All saved Excel
Options files that reside in the same folder as the WinCross
job file (*.job) are available
to use from the dropdown list of Saved
Excel options.
- You can also browse to a different
folder where saved Excel
Options files reside, using the Browse
option to the right of the Saved
Excel options: dropdown list.
- Last
Run or Last Saved is the last set of Excel
Options processed or saved.
- Choose Default
Settings from the dropdown list of Saved
Excel options to restore the options selected to the WinCross
defaults.
- Last
Run or Last Saved is automatically selected for each subsequent
visit to the Excel Options
dialog during the same WinCross session. This can be changed by selecting
Default Settings or a saved
set of Excel Options in the
dropdown list. You can also choose Browse
to select a saved set of Excel Options
from a different location than where the current WinCross job file
resides.
- Default
Settings is automatically selected the first time you visit
the Excel Options dialog for
a new WinCross session. This can be changed by selecting Last
Run or Last Saved or a saved set of Excel
Options in the dropdown list. You can also choose Browse
to select a saved set of Excel Options
from a different location than where the current WinCross job file
resides.
Data
Options tab: (at
least one Data option
of Include frequencies,
Include vertical percents,
Include horizontal percents
or Include constant percents
must be selected):
Include frequencies (WinCross
default)
Write
frequencies to the Excel report.
Include vertical
percents (WinCross
default)
Write
vertical percents to the Excel report.
Include horizontal
percents (WinCross
default)
Write
horizontal percents to the Excel report.
Include constant
percents (WinCross
default)
Write
constant percents to the Excel report.
Include
table of contents
(WinCross
default)
- Creates a worksheet with a name
of Table of contents.
- This worksheet is usually the first
worksheet of the workbook depending on the Worksheet
option selected and contains the table of contents for each
workbook.
- If there are multiple banners in
one workbook, there will be a table of contents worksheet for each
banner. The table of contents worksheet for the first banner will
have a name of Table of contents,
the table of contents worksheet for the second banner will have a
name of Table of contents(2),
etc.
- The table entries in the table of
contents are hyperlinked to the individual tables whether in the same
worksheet or as separate worksheets per table.
- You can include the table of contents
in the same worksheet as the tables for the Worksheet
options of Create all tables
in one worksheet, one banner per workbook or Create
one banner per worksheet, all in one workbook by enabling the In the same worksheet as tables
check box. The Include table of contents
option must be enabled to use this option.
- You can write the table of contents
to one worksheet in the same workbook when choosing the Create
one banner per worksheet, all in one workbook or the Create each table as a separate worksheet,
all in one workbook option by selecting the In
one worksheet for multiple banners option of Include
table of contents. This option is only useful if you
are processing more than one banner and want the table of contents
for each banner in one worksheet instead of three separate worksheets.
Generate
filtering column
(WinCross
default)
Creates
a hidden column to use for filtering what rows display on the Excel report.
Formatting
Options tab:
Show significance
indicators
(WinCross
default)
Show
significance indicators on the Excel report.
Position of significance
indicators, relative to the value
Choose
from the following options:
- Below
in the same cell - significance annotation is printed
below in the same cell as the vertical percent/mean.
- Below
in a separate cell - significance annotation is printed
in the cell/row below the vertical percent/mean (WinCross
default).
- To
the right, in the same cell - significance annotation
is printed to the right in the same cell as the vertical percent/mean.
- To
the right, in a separate cell - significance annotation
is printed in the column to the right of the cell for the vertical
percent/mean.
Put all text for
a row in a single cell
(WinCross
default)
Row
text is written as a continuous line, preventing text wrapping to multiple
cells.
Suppress all blank
lines (WinCross
default)
- All blank lines are removed.
- Suppress
all blank lines and Suppress
blank lines after significance testing items are mutually exclusive.
You must deselect one option to select the other option.
Suppress blank lines
after significance testing items
- The blank line that normally prints
after a line with significance testing items will not print if this
option is selected.
- When Suppress
blank lines after significance testing items has been selected,
Below in a separate cell is
the only Position of significance
indicators option that can be selected. The other Position
of significance indicators options are not valid when Suppress blank lines after significance
testing items has been selected.
- Suppress
blank lines after significance testing items and Suppress
all blank lines are mutually exclusive. You must deselect one
option to select the other option.
Suppress
blank lines after banners
The
blank line that normally displays/prints between the banner and the first
row of the table is suppressed.
Show % sign
on percents; set cell type to Percentage
(WinCross
default)
Displays
the percent sign next to percents on all tables and formats the cell as
a Percentage.
Hide %
sign on percents; set cell type to Number
Hides
the percent sign next to percents on all tables and formats the cell as
a Number.
Show
or hide % sign as specified in Table Options
Displays
the percent sign next to percents and formats the cell as a Percentage
or hides the percent sign next to percents and formats the cell as a Number based on the Show
percent sign (%) option of Setup|Tables|Table Options. This
option gives you the flexibility of formatting the tables as specified
in Table
Options where you may want to display the percent sign on some
times and suppress the percent sign on other tables.
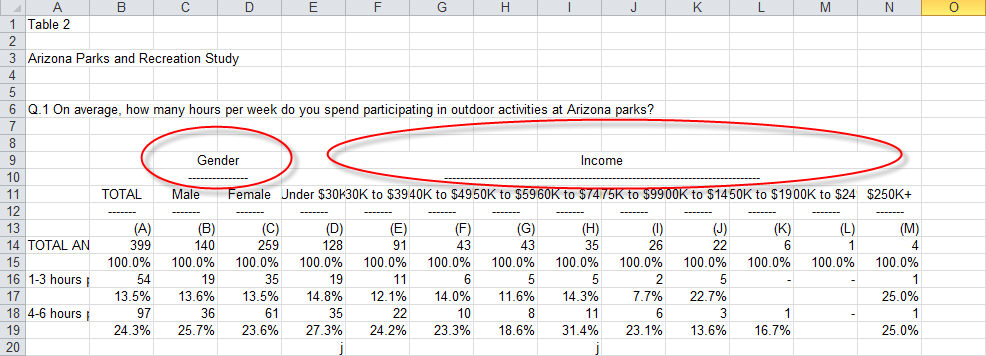
Concatenate banner
text that spans multiple columns
(WinCross
default)
Banner text that would normally span more than
one cell in Excel is merged into one cell. See the example below.
Combine tables
- Combines tables together with the
table title written to the left of the table.
- There is only one instance of the
banner columns while you scroll through the combined tables.
- Write
table title to the left of the table is automatically selected
when you choose the Combine tables
option.
- Choose the Freeze
banner option to freeze the banner columns of your table while
scrolling through the combined tables.
- Combine
tables is not a valid option when the Create
each table as a separate worksheet, one banner per workbook
or Create each table as a separate
worksheet, all in one workbook options are selected.
Freeze
banner
- When the Combine
tables option is selected, select Freeze
banner to freeze the banner columns of your table.
- This is especially useful when you
are scrolling through the combined tables in the worksheet as it keeps
those banner columns visible.
- There is only one instance of the
banner columns and these columns are frozen and stay visible while
you scroll through the combined tables.
Insert
page breaks
Maintains
the WinCross page breaks in the Excel report.
Write table title
to the left of the table
- Allows you to write the table title
to the left of the table.
- Write
table title to the left of the table is required when the Combine tables option is selected
and is automatically selected when you choose Combine
tables.
Freeze row text
- Allows you to freeze the row text
of your tables.
- This allows you to scroll through
the banner columns in the worksheet while it keeps the row text visible.
Worksheet
Options tab:
Create each table as a separate worksheet,
one banner per workbook
The
default file is named jobname.xlsx (or jobname.xls), however, you can
create a new file name by entering the file name in the Excel
file name field. A separate worksheet is created for each table.
All worksheets are contained in the same workbook. Each worksheet is labeled
by the table number (i.e. Table 1, Table 2, etc.).
If you
are running the tables against multiple banners, a variation of this file
naming scheme is used. For tables run against the first banner, the resulting
filename remains the same as above. When the tables are subsequently run
against additional banners, however, the workbook filenames become Excel file name_2.xlsx, Excel file name_3.xlsx
etc.
For
example, say you have table 1 and banners 2 and 4 for job name EXAMPLE-ASCII.job,
and you want to create separate Excel worksheets. When the task is complete,
WinCross will have named the files EXAMPLE-ASCII.xlsx
(Excel file for banner 2) and EXAMPLE-ASCII_2.xlsx
(Excel file for banner 4).
Create each table as a separate
worksheet, all in one workbook
The
default file is named jobname.xlsx (or jobname.xls), however, you can
create a new file name by entering the file name in the Excel
file name field. A separate worksheet is created for each table.
All worksheets are contained in the same workbook. Each worksheet is labeled
by the table number (i.e. Table 1, Table 2, etc.) regardless of the number
of banners run. The tables run by the first banner are written first with
each subsequent banner's tables being written next as separate worksheets
within the same workbook.
Create all tables in one worksheet,
one banner per workbook
The default file is named jobname.xlsx
(or
jobname.xls),
however, you can create a new file name by entering the file name in the
Excel file
name field. The worksheet
is labeled by the banner number (i.e. Banner 1). If multiple banners are
being used, a workbook for each of the banners is created.
If
you are running the tables against multiple banners, a variation of this
file naming scheme is used. For tables run against the first banner, the
resulting filename remains the same as above. When the tables are subsequently
run against additional banners, however, the workbook filenames become
Excel file name_2.xlsx, Excel file name_3.xlsx
etc.
Create one banner per worksheet, all
in one workbook
(WinCross
default)
The default file is named jobname.xlsx
(or
jobname.xls), however, you can create a new file name by entering the
file name in the Excel file name field. Each worksheet is labeled
by the banner number (i.e. Banner 1, Banner 2 etc.). When the Include
table of contents option is selected with this option, there will
be separate worksheets for each table of contents. For example, if tables
for 3 separate banners (Banner 1,
Banner 2 and Banner
3) are being written to Excel, the first worksheet will be named
"Table of contents",
the second worksheet will be named "Banner
1", the third worksheet will be named "Table
of contents(2)", the fourth worksheet will be named "Banner 2", the fifth worksheet
will be named "Table of contents(3)"
and the last worksheet will be named "Banner
3".
Report
Options tab:
Plain output (no
cell borders or colors)
Plain output produces an Excel report
with no background colors and
no cell borders. This is a quick and easy way to disable background colors
and
cell borders.
Note:
- The Plain output
option disables all Enhanced
output options including
background colors and cell borders.
- If
you would like to use cell borders but not background colors,
you can choose the Enhanced
output option and
either use the Use
Enhanced Text Report fonts and colors for Excel output option and choose the Clear All
option using Setup|Job
Settings|Enhanced Text Report
or the Use custom
colors option and
choose the Clear All option to clear all background
colors.
- If
you would like to use background colors but not cell borders,
you can choose the Enhanced
output option and
select the Disable
cell borders option
from the Excel Border
Options dialog.
|
Enhanced output (WinCross
default)
Use Enhanced Text
Report fonts and colors for Excel output
Uses
the Job
Settings|Enhanced Text Reports settings when writing the report
to Excel.
Use custom colors (WinCross
default)
Cell
Borders
(WinCross
default)
Allows
the selection of Excel Border Options
for the Excel report. Cell borders
are not
applicable if your Output file type
is Excel 97-2003 (.xls).
Disable cell borders
Select
this option to set all border styles (Table
border, Outside row border
and Inside row border) to None.
Choose border style for the following:
- Table
border
- Outside
row border
- Inside
row border
Note:
When the Table
border is set to a selection other than None, the Excel report begins in Column
"B". If you set the Table
border to None,
the Excel report begins in Column "A". |
Decimal
Place Options tab:
Frequency
- To override the number of decimal
places displayed on the WinCross report in Excel for frequencies,
select the Frequency check
box.
- From the dropdown list, select the
number of decimals to display for frequencies on the Excel report.
- You can choose between 0
and 8 decimal places.
Percent
- To override the number of decimal
places displayed on the WinCross report in Excel for percents, select
the Percent check box.
- From the dropdown list, select the
number of decimals to display for percents on the Excel report.
- You can choose between 0
and 8 decimal places.
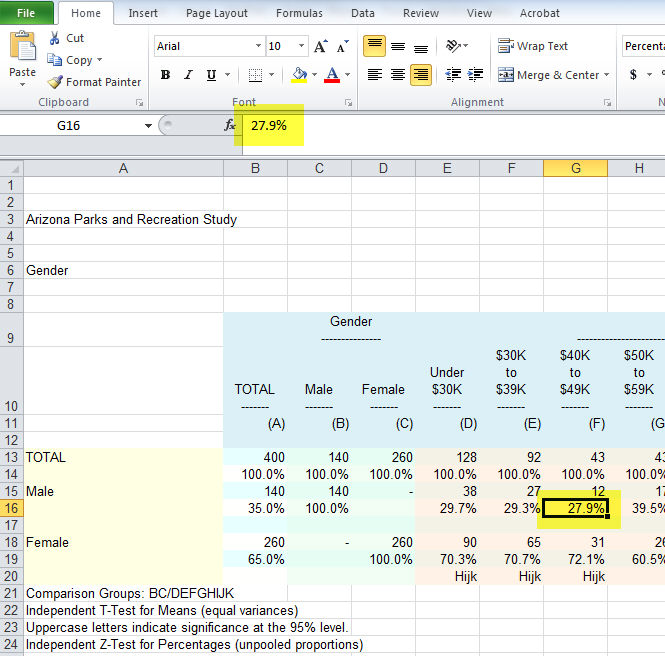
Round
the full-precision values saved to Excel to the number of decimal places
displayed in the Excel report itself
- This option allows you to specify
the decimal precision based on what is displayed rather than the actual
number in Excel.
- This can be helpful if you always
want your percents to add to 100%.
- Normally, when you click in a cell
with a value, it displays the real number in the formula bar of Excel.
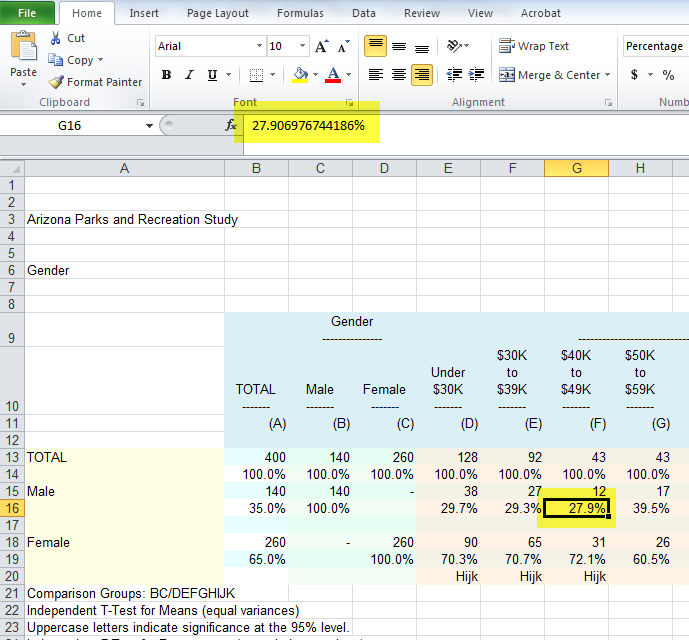
- Using this option, the real number
displayed in the formula bar of Excel, becomes the decimal precision
of what is displayed in Excel.
Related
topics:
Run|Tables