Row Options
You
can specify statistics and other settings for rows using Row
Options in Setup|Tables.
Note:
Use care when selecting multiple rows for editing row options.
The row options displayed will apply to all rows selected. |
- To change options for a single row,
select that row and choose the desired options.
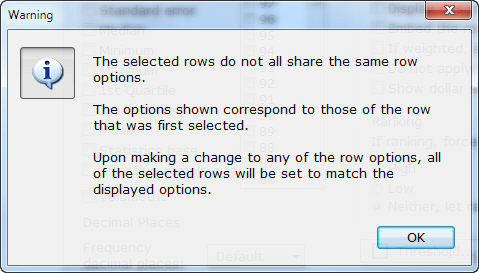
- To change options for more than one
row, select the rows and choose the desired options. If all of the
rows selected do not share the same row options, you will receive
a warning message to let you know the options shown correspond to
the options of the first row selected. Any change to row options for
the selected rows, will be set to match the displayed options.
- Choose Select
All to highlight all of the rows. If any of the rows selected
do not share the same row options, you will receive a warning message.
Any change to row options for the selected rows, will be set to match
the displayed options.
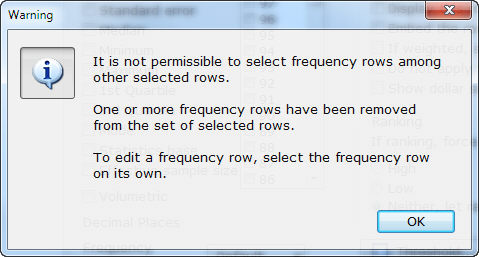
- When more than one row is selected
and one or more of those rows are defined as Frequency rows, you will receive
a warning message to let you know that Frequency
rows will not be selected with other rows for global changes. Frequency
rows can only be modified individually and not as part of a group.
- When more than one row is selected
and the Threshold option was
previously applied to one or more of the rows selected, you will receive
a warning message to let you know that Threshold
rows will not be included in the set of selected rows. Threshold
rows can only be modified individually and not as part of a group.

Frequency
Displays
the number of cases for each cell.
Vertical
percent
Displays
the percent of a cell based to the banner column total.
Horizontal
percent
Displays
the percent of a cell based to the row total.
Constant
percent
Displays
the percent of a cell based to a constant (either a specified constant
value or the intersection of a specified banner column and row (Total, Total
Answering or Sigma). Specify
the Constant value or Banner
column and Row (Total,
Total Answering or Sigma)
intersection using Setup|Banners|Edit
Banner|Horizontal /Constant Percents.
Sample
size for statistic base
Shows the
total number of respondents included in the specified calculations.
Mean
Reports
the sum of all values within a row divided by the number of values. There
are several situations where you would want a row mean:
- When the values of a row are defined
with ranges, a row mean must be used to define the values.
- Additionally, you might have a series
of rating scales and want your table to show only the mean for all
the ratings. In such an event, you don't have a table of data that
can be used to create a table statistic and you need to specify a
row mean. In mean summary tables, a row mean specifies the range of
values to use in calculating the mean, standard deviation and standard
error.
- When possible, use
a table mean rather than a row mean to use less memory and achieve
faster processing.
Mean
confidence interval - lower
Displays
the lower mean confidence interval based on the selected confidence interval
level specified using the Select
Level option. The confidence interval level specified is used
for calculating both
the lower and upper mean confidence interval.
Mean
confidence interval - upper
Displays
the upper mean confidence interval based on the selected confidence interval
level specified using the Select
Level option. The confidence interval level specified is used
for calculating both
the lower and upper mean confidence interval.
Standard
deviation
Reports
the set of values' variance from the mean.
Standard
error
Reports
the standard error of means. It is calculated by dividing the standard
deviation by the square root of the sample size.
Median
Reports
the middle value of all values. The row median does interpolate if the
value falls at exactly 50%.
Minimum
Reports
the minimum value.
Maximum
Reports
the maximum value.
1st
Quartile
Reports
the value where 25% of the values fall below that value and 75% of the
values fall above it.
3rd
Quartile
Reports
the value where 25% of the values fall above that value and 75% of the
values fall below it.
Mode
Reports
the value that occurs most often.
Effective
sample size for statistic base
Creates
a row on your table displaying the effective sample size used when calculating
T-scores for significance testing on means.
Mean
number of mentions
Reports
the total number of responses divided by the total number of respondents
for the row.
Volumetric
- If your row uses volumetric data
(such as the number of cars owned or total employees), you can select
Volumetric to have the row
show volume, rather than the count of cases.
- When using the CALC statement for rows with the
volumetric option selected, you can use the
F (Frequency) in the CALC
statement for those rows (for example, CALC
F1 + F2 will add the volumetric count for rows 1 and 2).
Note:
The Volumetric
row option cannot be selected with other statistical cell row
options. |
Percentiles
- Select the Percentiles
(from 0 to 99) that you would like to show on your row.
- Percentiles
show the value where the selected percentage of the values fall below
and the remainder fall above.
- For example, if you select the 10th
Percentile, this will display the value where 10% of the values fall
below and 90% fall above.
Frequency
decimal places
- Specify the number of decimal places
for Frequency. Select 0, 1,
2 or 3
to override the Default
setting.
- The setting of Default
reflects the Frequency decimal places
setting for the table specified in Setup|Tables|Table Options.
- Unweighted counts are always whole
numbers.
Percent decimal places
- Specify the number of decimal places
for all percents using this function. Select 0,
1, 2
or 3
to override the Default setting.
- The setting of Default
reflects the Percent decimal places
setting for the table specified in Setup|Tables|Table Options.
Statistic decimal places
- Specify the number of decimal places
for statistics (e.g. Mean,
Median, Minimum,
Maximum, etc.) using this
function. Select 0,
1, 2
or 3
to override the Default setting.
- The setting of Default
reflects the Central tendency decimal
places setting for the table specified in Setup|Tables|Statistics.
Variability decimal places
- Specify the number of decimal places
for Standard deviation and
Standard error using this
function. Select 0,
1, 2
or 3
to override the Default setting.
- The setting of Default
reflects the Variability decimal
places setting for the table specified in Setup|Tables|Statistics.
Show
row
Forces
a row to print if it would normally be suppressed because Hide
blank rows is selected in Table Options
in Setup|Tables.
For example, you might want to print row text you created to use as a
descriptive title, but it has no logic and would be ‘blank,’ and otherwise
suppressed.
Hide
row
Row will
not display/print on your report. For example, you might have a row that
is necessary for a calculation in a table, but you don't want that row
to print.
Hide
row if blank
Suppress
rows without data. For example, you might have a ‘DON'T KNOW’ row that
you want to suppress if it is blank.
Skip
a line after this row
Displays/prints
a blank line after the row.
Append
next row to this row
Will not
display/print a blank line after the row. You might use this feature to
print an extra line of text for the row above (you would leave the row
logic blank). An appended row ‘moves with’ the row it is appended to when
that row is ranked.
Display
this row on a new page
Displays
this row on a new page. For example, you might want the first row of a
net to print at the top of a new page.
Embed
the row title (margin release)
- Creates a row of title text (rather
than a row of data) that starts in the left margin of the table. Enter
the text. Do not specify any logic for the row.
- Enable the Show
row option to display this row with no logic.
- Disable the Skip
a line after this row option to display this row and a subsequent
row of logic directly under it.
If
weighted, show this row unweighted
Displays
the row unweighted when weighting is being applied to the tables.
Do
not apply filter to this row
- Excludes a row from a filter. This
feature lets you define rows that don't meet the filter base.
- When you select Do
not apply filter to this row, a row appears on the table if
any respondents meet the logic for the row, regardless of the table's
filter.
- You might use this feature to apply
balancing lines for a table.
Show
dollar sign ($)
Displays
dollar signs on rows with dollar values.
If
ranking, force row to rank
- If you don't want a row to be ranked
within the table, select High
to force the row to the top of the table, or Low
to force the row to the bottom of the table. For example, you might
have an ‘ALL OTHER MENTIONS’ row that you want to print at the bottom
of a table, net, or subtotal group of rows.
- To let the row be ranked within
the table, select Neither,
let rank determine.
- To group rows together, use
the Assign
rows to groups option.
Threshold
Specifies
an ‘other’ row, which represents all rows that are less than the minimum
percent or frequency that you specify. When you create an ‘other’ row
using the Threshold
feature, you can you control the
row placement and text for the ‘other’ row.
- Select Threshold.
- Choose Percent
or Frequency.
- Specify the minimum percent or frequency
in the Limit field.
- Enable the Apply across NETs and
SUBs check box to include rows that are included in a net or sub.
Note:
If the Apply
across NETs and Subs checkbox is not
enabled, the Threshold
row option only works on rows that are not
included in any net or sub. |
Underline
You
can underline row text with any of five characters.
- Select Underline
to select an Underline character
and Underline length.
- Select one of these characters: an
Equal sign (=),
Dash (-),
Underscore (_),
Asterisk (*)
or Plus sign (+).
- Select Underline
length of: Length of last line (as long as the
last line of row text), Length of
longest line (as long as the longest line within the row) or
Width of entire row (the row's
maximum width, as defined in Setup|Job
Settings|Table Presentation for Plain
Text Reports or Setup|Banners
for Enhanced Text Reports).
- Click Remove
to remove previous underlining specifications.
Frequency
Close
Use
Close to exit the Row
Options dialog. Changes are not saved until you select either Apply Changes to Selected Rows or
Apply Changes to All Rows.
Cancel
Use
Cancel to exit the Row
Options dialog without saving changes.
Related topics:
About Row Statistics
Setup|Tables